Overview
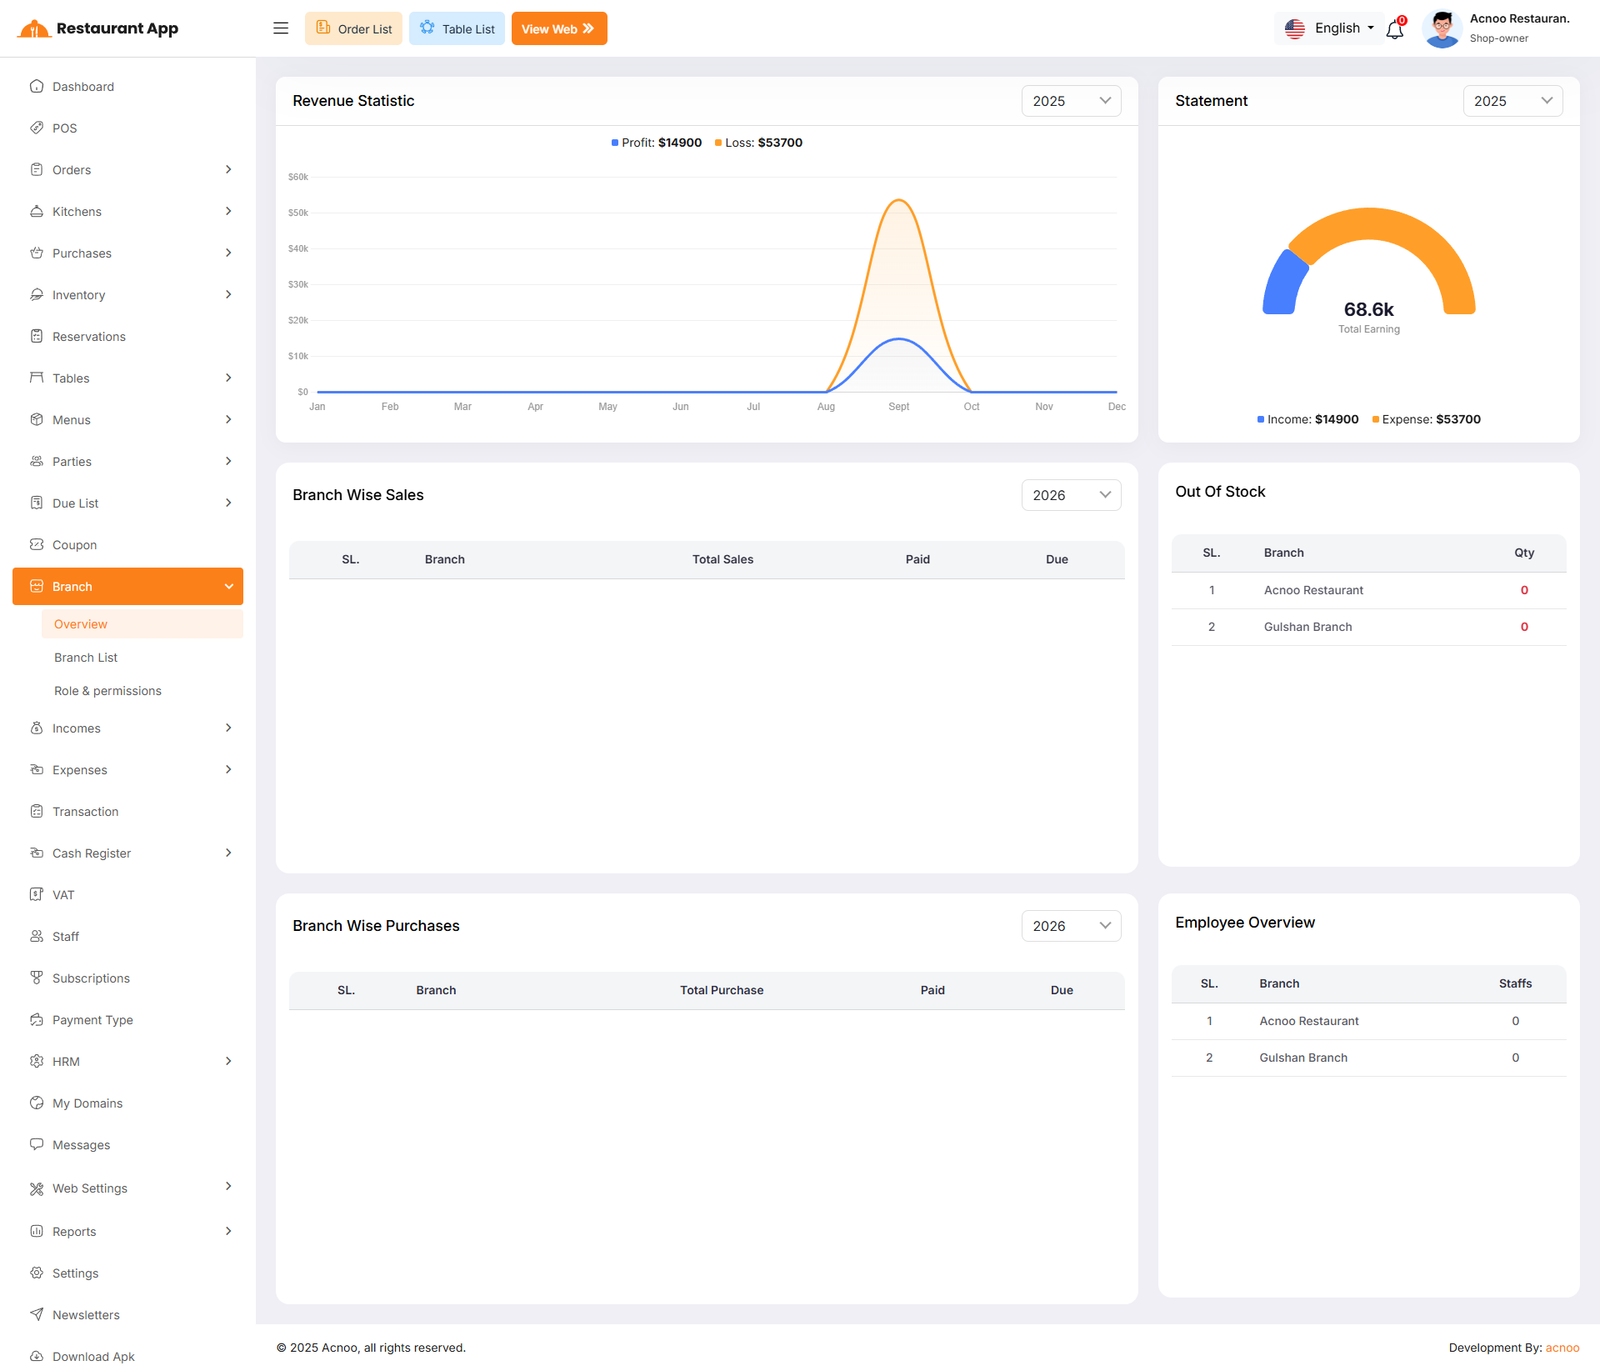
Here, you can view an overview of all branches. The revenue statistics are displayed, and you can select a year to dynamically update the chart for the chosen period. A pie chart shows profit and loss, with a yearly dropdown available for selection. Similarly, you can view branch-wise sales and purchase lists. The system also displays the quantity of expired products in each branch, as well as an employee overview showing the number of employees per branch.