Overview
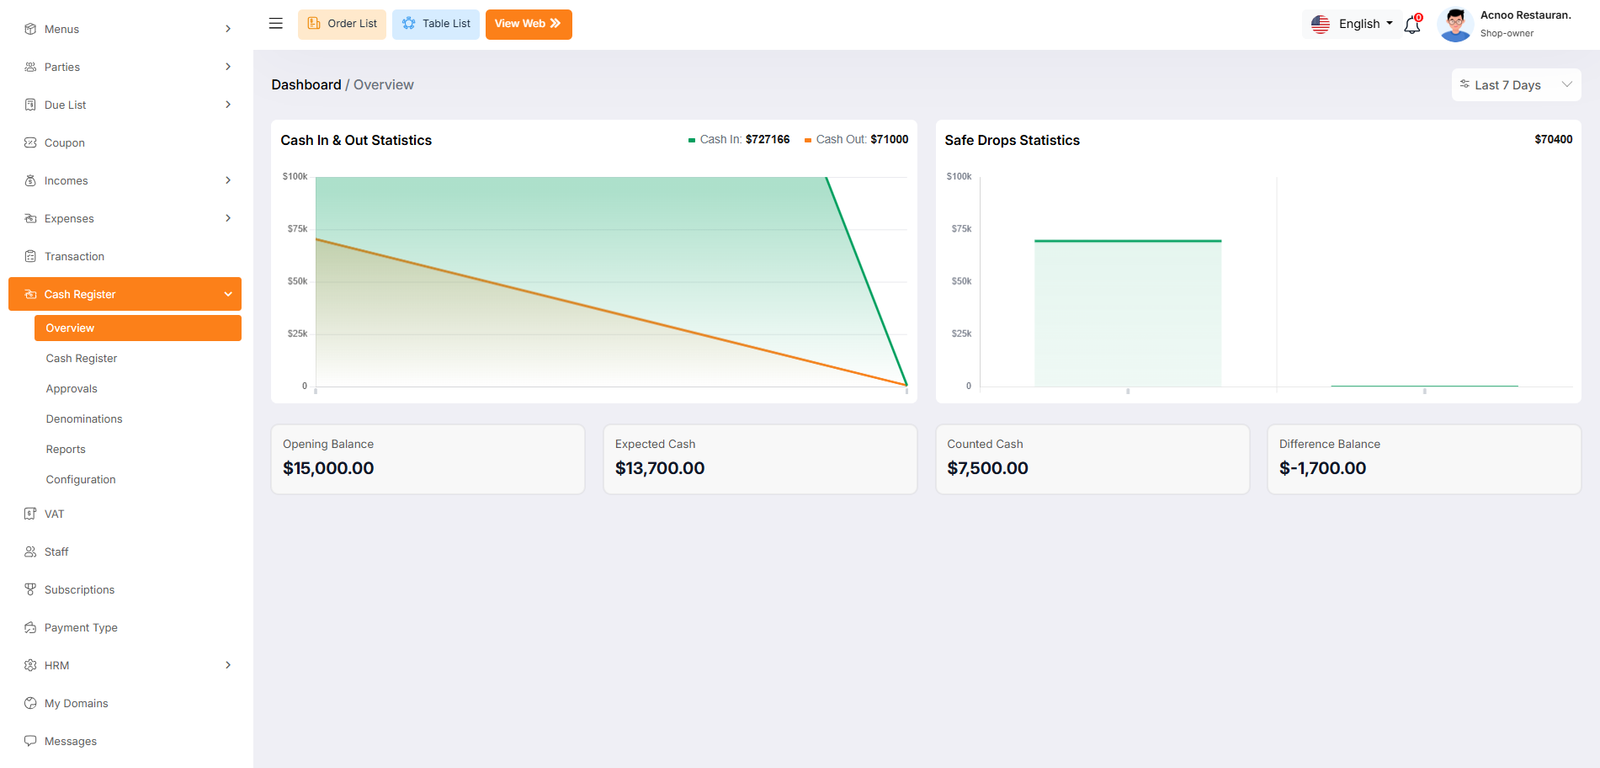
The Overview page serves as the central command center for monitoring the financial health of your restaurant's cash operations. It provides high-level visual analytics and summary totals, allowing managers to track trends in cash flow, security drops, and overall counting accuracy over time.
Visual Analytics (Graphs)
Two primary charts help identify patterns in how money enters and leaves the business:
- Cash In & Out Statistics: This area chart compares manual funds added (Cash In - Green) versus funds removed (Cash Out - Orange). Monitoring this graph helps identify days with unusually high payouts or manual deposits.
- Safe Drops Statistics: This bar chart tracks the frequency and volume of money moved to the safe. Steady bars indicate consistent security practices, while gaps might suggest that the drawer is being left with too much cash on hand.